
Posts
What Is an FTIR Spectroscopy Machine and How Does It Work?
A Ftir Spectroscopy Machine turns invisible infrared interactions into readable chemical information. It helps analysts examine solids, liquids, powders, films, and gases with limited sample preparation. The instrument does not “see” a sample like a camera. Instead, it measures how molecular bonds absorb infrared energy at different frequencies.
Peter R. Griffiths, a respected infrared spectroscopy researcher and co-author of Fourier Transform Infrared Spectrometry, wrote, “Infrared spectroscopy is one of the most important tools for the identification of organic compounds.” His statement remains relevant in modern laboratories. A typical machine includes an infrared source, an interferometer, a sample compartment, and a detector. The interferometer creates a combined light signal. Software then converts the measured pattern into a spectrum through Fourier transformation.
The resulting spectrum often resembles a molecular fingerprint. Peaks can suggest functional groups, contamination, moisture, oxidation, or material differences. For example, a polymer film may show changes after heat exposure. A powder may reveal an unexpected ingredient or degraded component. Still, interpretation is not automatic. A database match can look convincing and remain wrong. Poor contact, atmospheric water vapor, dirty accessories, or an unsuitable sampling method may distort results. That is where practical experience matters. Analysts should inspect the spectrum, verify reference materials, and repeat questionable measurements. The machine offers evidence, not certainty. This article explains how a Ftir Spectroscopy Machine works, what each component contributes, and where careful human judgment remains essential.
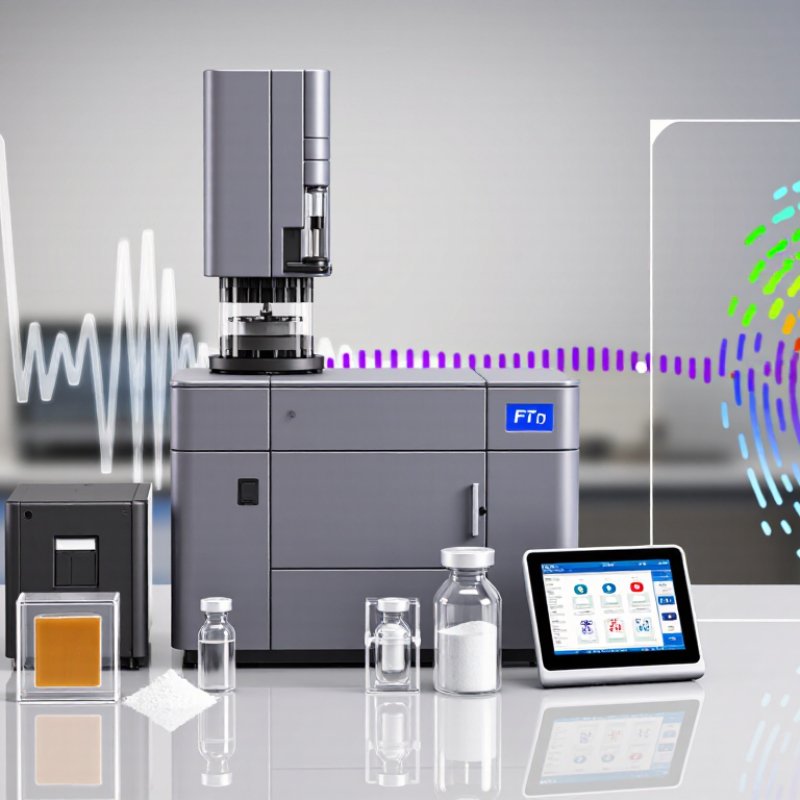
FTIR Spectroscopy Machines: Definition and the 4000–400 cm⁻¹ Range
An FTIR spectroscopy machine measures how a sample interacts with infrared light.
FTIR means Fourier transform infrared spectroscopy. It is widely used to identify materials, monitor reactions, and check contamination. The instrument sends infrared energy through, or onto, the sample. An interferometer modulates many wavelengths at once. A detector records the combined signal, called an interferogram. Software then applies a Fourier transform and produces a spectrum.
The most familiar mid-infrared region is 4000–400 cm⁻¹. Here, wavenumber describes the number of waves per centimeter. Higher values often show stretching vibrations, such as O–H, C–H, or N–H bonds.
Lower values contain the fingerprint region, where complex molecular patterns help distinguish similar compounds. A peak at one position is useful, but the complete pattern matters more. Small details matter.
In practical testing, an operator may place a solid directly on an ATR crystal, inject a liquid, or measure a gas cell. The crystal must be clean and pressed consistently. A background scan should be collected before the sample.
Water vapor and carbon dioxide can leave unwanted features, especially when the path is poorly controlled. Resolution, baseline correction, and sample thickness also affect the result. FTIR is powerful, but it does not identify every unknown perfectly. Some spectra overlap, and interpretation still requires reference data, chemical knowledge, and cautious judgment.
Core Components: IR Sources, Michelson Interferometers, and Detectors
An FTIR spectroscopy machine identifies materials by measuring how they absorb infrared radiation. Its infrared source sends a broad beam toward a Michelson interferometer. The interferometer divides the beam with a beam splitter, reflects it from two mirrors, and recombines it after creating a controlled path difference. The resulting interference pattern is called an interferogram. A computer applies a Fourier transform and converts that signal into a spectrum.
The source must remain stable across the selected infrared range. A warm ceramic emitter is common for mid-infrared work, while optical windows protect the beam path from moisture. Small alignment errors can reduce spectral quality. They matter more than many beginners expect. The detector then measures the returning intensity, often using a pyroelectric or mercury-cadmium-telluride design. Detector choice affects speed, sensitivity, and usable wavelength range.
A 2024 market analysis estimated the global FTIR market would grow at roughly 7% annually through the decade, reflecting wider use in laboratories and process monitoring. The International Organization for Standardization’s ISO 2022 guidance on infrared analysis also emphasizes calibration, background correction, and controlled sampling conditions. These steps are practical, not decorative. In my experience, a clean background scan can prevent more trouble than expensive hardware. Still, the instrument is not infallible. Water vapor, dirty crystal surfaces, and poor contact can distort peaks. A spectrum should therefore be checked against validated reference data, such as the National Institute of Standards and Technology Chemistry WebBook, before reporting a confident identification.
Step 1—Interferogram Capture: How Moving Mirrors Encode Spectra
An FTIR spectroscopy machine measures how infrared light interacts with a sample. Instead of separating wavelengths with a prism, it records combined light signals. The crucial evidence begins inside the interferometer. A broadband infrared beam reaches a beamsplitter, which directs portions toward a fixed mirror and a moving mirror. The returning beams recombine. Their path difference changes as the moving mirror travels.
At each mirror position, the detector receives a slightly different interference pattern. Constructive interference strengthens some wavelengths, while destructive interference weakens others. The detector converts these changing intensities into an electrical signal. That trace is the interferogram. It contains all the spectral information, but not in an immediately readable form. A central, intense peak usually appears when the two optical paths nearly match. Smaller oscillations extend on both sides of this peak. Their spacing reflects the wavelengths present in the infrared beam.
In practical laboratory work, mirror motion must remain highly controlled. Even small position errors can blur absorption bands after mathematical processing. A reference laser often tracks mirror displacement, while software assigns each detector reading to an accurate optical path difference. The Fourier transform then converts the interferogram into a conventional spectrum. The process is precise, but not perfect. Vibration, moisture, and alignment changes can still affect the result. I have found that checking the raw interferogram is useful; a distorted trace may reveal trouble before the final spectrum looks suspicious.
FTIR Step 1: Interferogram Capture
A moving mirror changes the optical path difference (OPD) in the interferometer. The detector records the resulting intensity variation as an interferogram. Different wavenumbers create different oscillation frequencies in the signal, which can later be transformed into an infrared spectrum.
Optical path difference is shown in centimeters. Detector signal is normalized to the centerburst intensity, where the two interfering beams are most closely aligned.
Step 2—Fourier Transformation: Converting Signals into cm⁻¹ Spectra
Inside an FTIR spectrometer, the detector first records an interferogram, not a familiar spectrum. A moving mirror changes the optical path difference. Light waves then strengthen or cancel each other. The detector captures these intensity changes over time. A Fourier transform converts this complex signal into intensity versus wavenumber, measured in cm⁻¹. The NIST Chemistry WebBook, Standard Reference Database 69, commonly presents infrared data across the 4000–400 cm⁻¹ region. This range covers many practical molecular vibrations.
The computer also applies phase correction and apodization before displaying the spectrum. These steps reduce edge artifacts and improve readability. Resolution matters here. ASTM E1252-23 describes infrared spectral measurement practices, including resolution and sampling considerations. Higher resolution can separate nearby peaks, but it usually requires longer scans. More scans improve the signal-to-noise ratio through averaging. Still, a clean-looking spectrum can mislead. Baseline drift, water vapor, or an overloaded detector may create false confidence. The transformation is mathematical, but the result depends on the original signal quality.
Tips: Check the interferogram before trusting the peaks. Confirm the wavenumber calibration with a certified reference material. Use consistent resolution and scan counts between samples. In daily laboratory work, small settings matter. I sometimes prefer a slightly slower scan when weak bands carry the main evidence. That choice is not perfect, but it is easier to defend.
Performance Metrics: 0.5–4 cm⁻¹ Resolution and 10–100 Scan Averaging
An FTIR spectroscopy machine identifies chemical bonds by measuring how a sample absorbs infrared light. A source sends infrared radiation through or onto the sample. The detector records absorption across different wavenumbers. The resulting spectrum shows peaks linked to molecular vibrations, such as stretching and bending.
Resolution describes how closely two spectral peaks can appear and still remain distinguishable. A setting of 0.5 cm⁻¹ reveals narrow, overlapping features with greater detail. It can help separate similar compounds or examine small structural changes. A 4 cm⁻¹ setting collects data faster and often suits routine identification.
Higher resolution does not automatically mean better results. Poor sampling can still produce misleading spectra.
Scan averaging reduces random noise by combining repeated measurements. Ten scans may support quick screening, while 50 to 100 scans can improve weak-signal visibility. The improvement follows diminishing returns. Doubling scans does not double practical sensitivity.
A clean sample surface, stable background, and consistent pressure matter just as much. Atmospheric water vapor can create unwanted features.
I would not trust a sharp spectrum without checking the baseline and repeating the measurement. That shortcut is tempting.
For reliable interpretation, analysts should compare peak positions, intensities, and repeatability rather than relying on one prominent band. Even experienced users sometimes overinterpret small peaks.
